


K
Size: a a a
2020 June 11
K
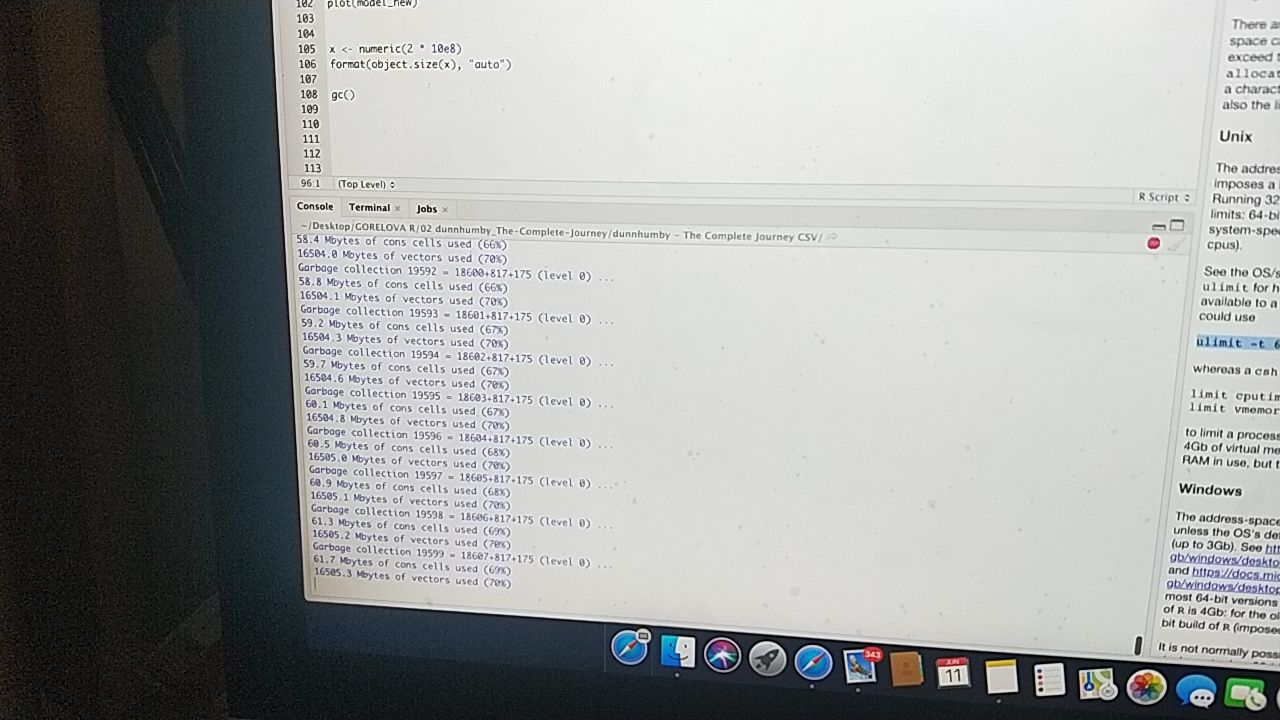
Garbage collection..
А
Круто, фотки экрана
АК
Круто, фотки экрана
Да ни дня без них вроде бы.
АК
Garbage collection..
Не смертельно. Просто отчитывается.
K
Я то могу выслать строки но смысл. Они одна за одной идут и смысл их высылать это же не элемент кода 😔
K
Не смертельно. Просто отчитывается.
Но при этом Р выполняет мою команду?
YK
добрый вечер, есть вопрос. я хочу соединить два датасета по двум переменным, что-то вроде такого:
но в df$z есть NA. как сделать так, чтобы в случае, если есть NA, строки соединялись только по одной из группирующих переменных?
df1 = data.frame(x = c("a","b","a","b","c"),
                  y = c(10,20,30,20,10),
                  z = c(1,2,1,NA,2))

df2 = data.frame(x = c("b","b","c","a","a"),
                  y = c(30,20,10,10,20),
                  z = c(2,1,2,1,1))

df = merge(df1, df2, by = c("z", "x"), all = T)
но в df$z есть NA. как сделать так, чтобы в случае, если есть NA, строки соединялись только по одной из группирующих переменных?
a
Я бы соединял в два этапа: сначала по двум один сабсет, а потом по одной другой сабсет
2020 June 12
A
Коллеги, доброго времени! Подскажите, есть ли какой-то метод кластеризации, учитывающий разброс для каждого объекта?
У нас есть 100 объектов, который оценивали по двум шкалам N человек.
Воспринимать за условную точку на скаттерплоте среднее для объекта по одной из шкал кажется не самым разумным. Вроде бы будет лучше получать оценки вероятности близости к какому-то кластеру, но метода не знаю.
Смотрел correspondence analysis, dbscan - не совсем то.
ЕТ
A
Коллеги, доброго времени! Подскажите, есть ли какой-то метод кластеризации, учитывающий разброс для каждого объекта?
У нас есть 100 объектов, который оценивали по двум шкалам N человек.
Воспринимать за условную точку на скаттерплоте среднее для объекта по одной из шкал кажется не самым разумным. Вроде бы будет лучше получать оценки вероятности близости к какому-то кластеру, но метода не знаю.
Смотрел correspondence analysis, dbscan - не совсем то.
У нас есть 100 объектов, который оценивали по двум шкалам N человек.
Воспринимать за условную точку на скаттерплоте среднее для объекта по одной из шкал кажется не самым разумным. Вроде бы будет лучше получать оценки вероятности близости к какому-то кластеру, но метода не знаю.
Смотрел correspondence analysis, dbscan - не совсем то.
Погуглите "мягкая кластеризация", "нечёткая кластеризация".
A
Погуглите "мягкая кластеризация", "нечёткая кластеризация".
шикарно, спасибо!
АК
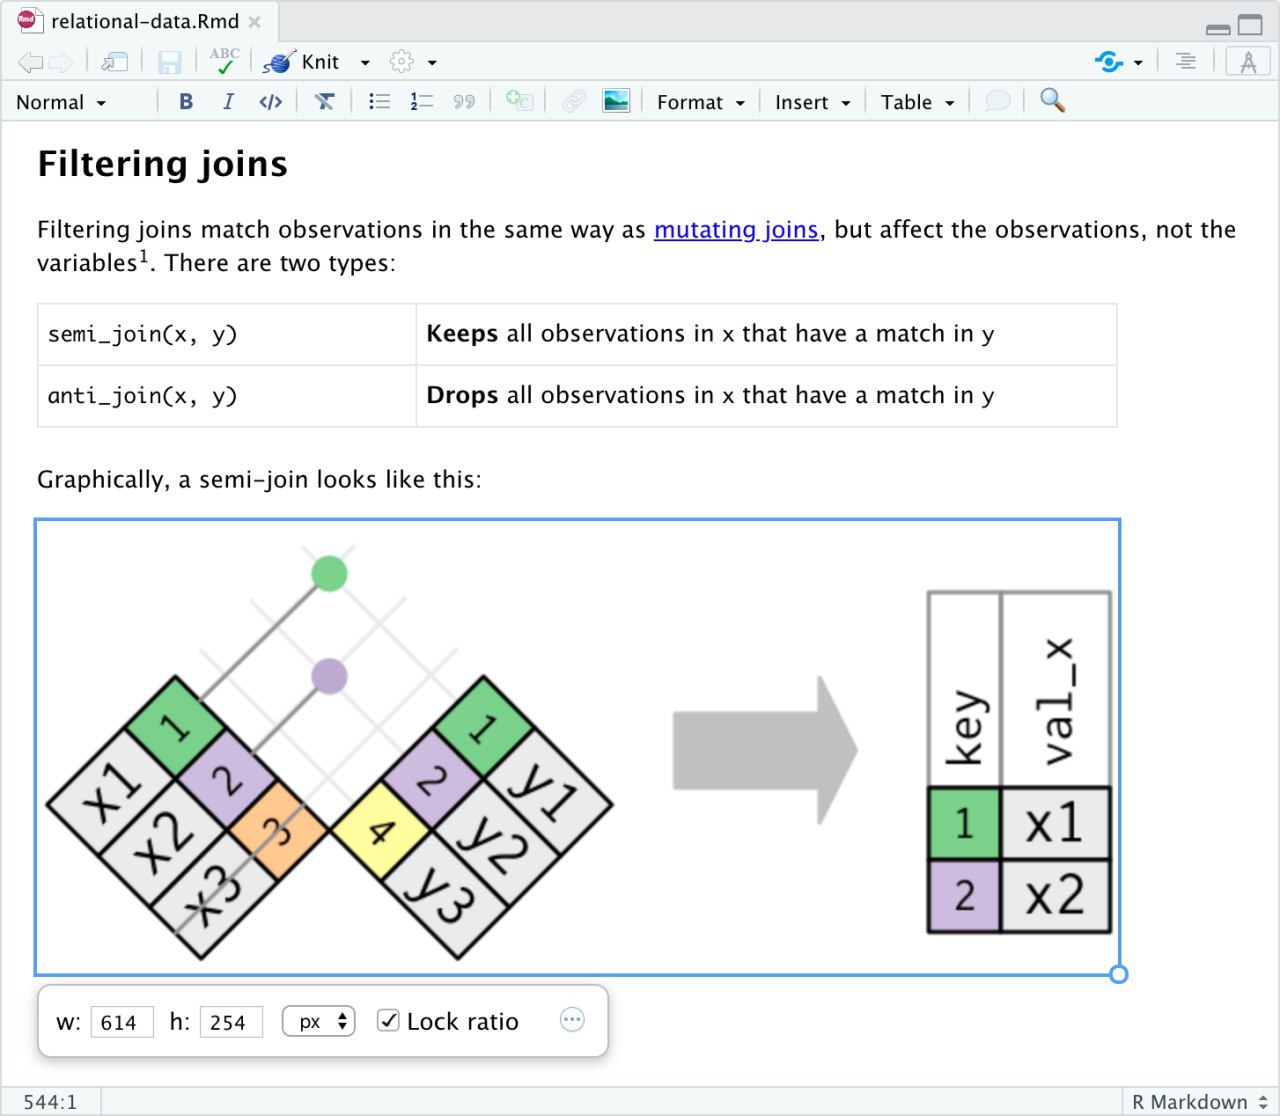
Visual R Markdown
RStudio v1.4 includes an experimental visual markdown editing mode. Highlights of visual mode include:
Visual editing for all of Pandoc markdown, including tables, footnotes, citations, divs/spans, definition lists, id/class attributes, equations, TeX, and HTML.
Tight integration with source editing (editing location and undo/redo state are preserved when switching between modes).
Rich keyboard support. In addition to traditional shortcuts, you can use markdown expressions (e.g. ##, bold, etc.) for formatting. If you don’t remember all of the keybaord shortcuts, you can also use the catch-all ⌃ / shortcut to insert anything.
https://rstudio.github.io/visual-markdown-editing/
АК
Visual R Markdown
RStudio v1.4 includes an experimental visual markdown editing mode. Highlights of visual mode include:
Visual editing for all of Pandoc markdown, including tables, footnotes, citations, divs/spans, definition lists, id/class attributes, equations, TeX, and HTML.
Tight integration with source editing (editing location and undo/redo state are preserved when switching between modes).
Rich keyboard support. In addition to traditional shortcuts, you can use markdown expressions (e.g. ##, bold, etc.) for formatting. If you don’t remember all of the keybaord shortcuts, you can also use the catch-all ⌃ / shortcut to insert anything.
https://rstudio.github.io/visual-markdown-editing/
RStudio v1.4 includes an experimental visual markdown editing mode. Highlights of visual mode include:
Visual editing for all of Pandoc markdown, including tables, footnotes, citations, divs/spans, definition lists, id/class attributes, equations, TeX, and HTML.
Tight integration with source editing (editing location and undo/redo state are preserved when switching between modes).
Rich keyboard support. In addition to traditional shortcuts, you can use markdown expressions (e.g. ##, bold, etc.) for formatting. If you don’t remember all of the keybaord shortcuts, you can also use the catch-all ⌃ / shortcut to insert anything.
https://rstudio.github.io/visual-markdown-editing/
Ю
Прикольно. Если мне память не изменяет, был какой-то аддон, позволявший при редактировании сразу видеть что получается
MM
#четверг_который_прикидывается_пятницой #музыкальная_пауза Data Science
Statisticians
(Repeat)
Academic classical statistician, sit down and listen
You’re about to witness the power of algorithms
Linear regressions is suckin’ us into a recession
Interpretability is dead, the gold standard is now prediction
Please, you think ‘cause a method is new, it isn’t bad?
Everything about your “big data” movement is a fad
All you have is a glittering enigma wrapped in a complex riddle
Nothing but a black box with lots of little knobs to twiddle
I’ll take a black box that delivers accurate answers
On any question you can ask it, from genetics to cancer
Over a transparent box we understand that’s “interpretable”
With tractable math…
Yeah, too bad it doesn’t work so good though
Algorithms are just another kind of statistical inference
That’s fine. You’re advocating scientifical ignorance
You’re like the Wizard of Oz in a balloon, floating over the earth
"Come back!"
“I can’t! I don’t know how it works!”
Here’s how it works: data goes in, predictions emerge
Talk to Mark Zuckerberg if you really question its worth
Forget it, stay bottled up in a college and data model
I’ll solve problems, drive an Audi, and date a model
Data science, we predict the outcome
And if you see it's workin’, there’s no need to question “how come?”
Statisticians, we want it precise
How is it “science” if you can’t explain your model designs?!?
Data science, we don’t want it basic
Life is complicated, the original “black box” is nature
Statisticians, reveal how nature functions
All I need is a model with articulated assumptions
Is that too much to ask from a data analyst?
Show your work!? That’s basic practice, but they can't handle it
Move fast, break things, it just isn't right
Not at the expense of parsimony and scientific insight
You got it backwards, pops, scientific progress
Is a step-by-step process from simple to complex
Quantum physics comes after Newtonian mechanics
And classic statisticians never discovered exoplanets
You’re the one with the model backwards, son, you got distracted
We get results!
Yeah, with no thought for the causal factors
Tech investors keep earning, algorithms keep churning
But it’s a shallow journey if only the machine’s learning
We’re learning, never doubt that, data science is about facts
And if it catches mice, that makes it a better mousetrap
Statistics is either gonna get with artificial intelligence
Or it’s gonna lose in the data battle for relevance
Well if that’s your position, then I'm a converted mathematician
First, check if it works, and then unpack the algorithm
With statistical methods; that’s just more for us to perceive
Just don’t lose sight of the random forest for the trees
Data science, we predict the outcom
First check if it's workin’, and then question “how come?”
Statisticians, we want it precise
How is it “science” if you can’t explain your model designs?
Data science, we don’t want it basic
Life is complicated, the original black box is nature
Statisticians, reveal how nature functions
All I need is a model with articulated assumptions
Data Science
Statisticians
(Repeat) https://www.youtube.com/watch?v=uHGlCi9jOWY
Statisticians
(Repeat)
Academic classical statistician, sit down and listen
You’re about to witness the power of algorithms
Linear regressions is suckin’ us into a recession
Interpretability is dead, the gold standard is now prediction
Please, you think ‘cause a method is new, it isn’t bad?
Everything about your “big data” movement is a fad
All you have is a glittering enigma wrapped in a complex riddle
Nothing but a black box with lots of little knobs to twiddle
I’ll take a black box that delivers accurate answers
On any question you can ask it, from genetics to cancer
Over a transparent box we understand that’s “interpretable”
With tractable math…
Yeah, too bad it doesn’t work so good though
Algorithms are just another kind of statistical inference
That’s fine. You’re advocating scientifical ignorance
You’re like the Wizard of Oz in a balloon, floating over the earth
"Come back!"
“I can’t! I don’t know how it works!”
Here’s how it works: data goes in, predictions emerge
Talk to Mark Zuckerberg if you really question its worth
Forget it, stay bottled up in a college and data model
I’ll solve problems, drive an Audi, and date a model
Data science, we predict the outcome
And if you see it's workin’, there’s no need to question “how come?”
Statisticians, we want it precise
How is it “science” if you can’t explain your model designs?!?
Data science, we don’t want it basic
Life is complicated, the original “black box” is nature
Statisticians, reveal how nature functions
All I need is a model with articulated assumptions
Is that too much to ask from a data analyst?
Show your work!? That’s basic practice, but they can't handle it
Move fast, break things, it just isn't right
Not at the expense of parsimony and scientific insight
You got it backwards, pops, scientific progress
Is a step-by-step process from simple to complex
Quantum physics comes after Newtonian mechanics
And classic statisticians never discovered exoplanets
You’re the one with the model backwards, son, you got distracted
We get results!
Yeah, with no thought for the causal factors
Tech investors keep earning, algorithms keep churning
But it’s a shallow journey if only the machine’s learning
We’re learning, never doubt that, data science is about facts
And if it catches mice, that makes it a better mousetrap
Statistics is either gonna get with artificial intelligence
Or it’s gonna lose in the data battle for relevance
Well if that’s your position, then I'm a converted mathematician
First, check if it works, and then unpack the algorithm
With statistical methods; that’s just more for us to perceive
Just don’t lose sight of the random forest for the trees
Data science, we predict the outcom
First check if it's workin’, and then question “how come?”
Statisticians, we want it precise
How is it “science” if you can’t explain your model designs?
Data science, we don’t want it basic
Life is complicated, the original black box is nature
Statisticians, reveal how nature functions
All I need is a model with articulated assumptions
Data Science
Statisticians
(Repeat) https://www.youtube.com/watch?v=uHGlCi9jOWY
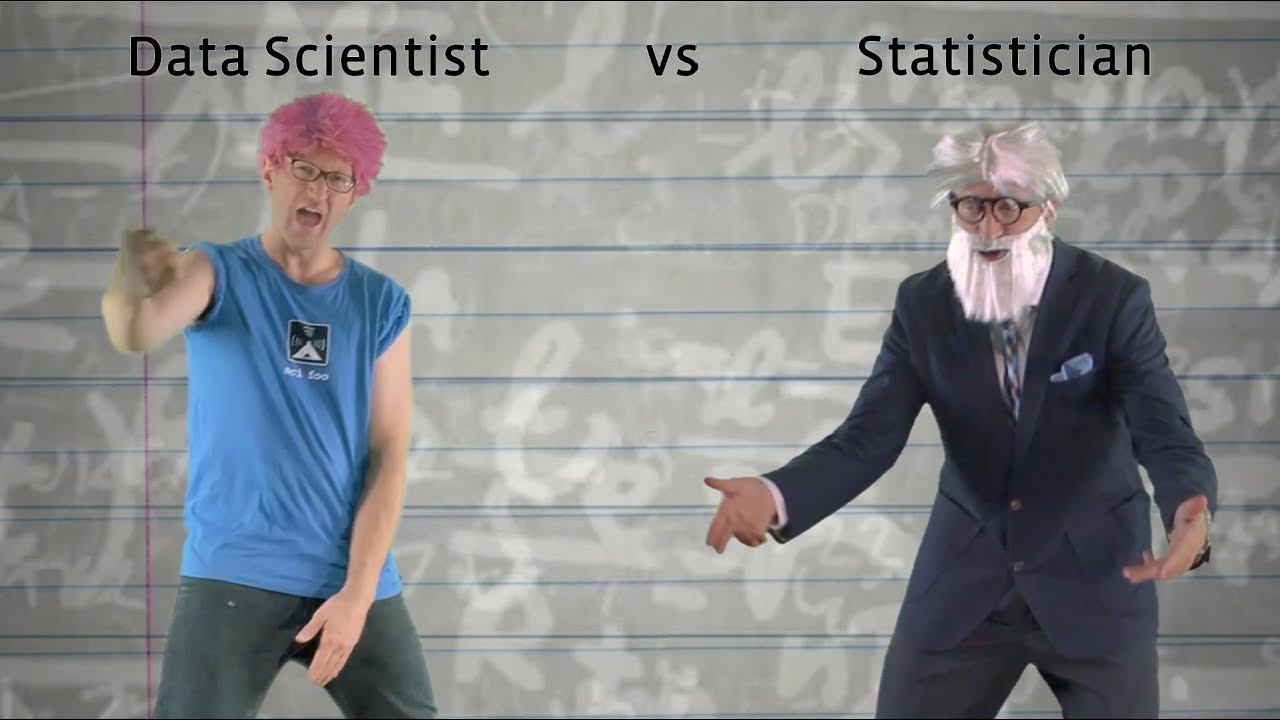
Гениально
MM
A
Коллеги, доброго времени! Подскажите, есть ли какой-то метод кластеризации, учитывающий разброс для каждого объекта?
У нас есть 100 объектов, который оценивали по двум шкалам N человек.
Воспринимать за условную точку на скаттерплоте среднее для объекта по одной из шкал кажется не самым разумным. Вроде бы будет лучше получать оценки вероятности близости к какому-то кластеру, но метода не знаю.
Смотрел correspondence analysis, dbscan - не совсем то.
У нас есть 100 объектов, который оценивали по двум шкалам N человек.
Воспринимать за условную точку на скаттерплоте среднее для объекта по одной из шкал кажется не самым разумным. Вроде бы будет лучше получать оценки вероятности близости к какому-то кластеру, но метода не знаю.
Смотрел correspondence analysis, dbscan - не совсем то.
Можно ещё попробовать многомерное шкалирование, а потом кластеризовать
A
Можно ещё попробовать многомерное шкалирование, а потом кластеризовать
Спасибо!

FA
привет, ищу вот эту книгу в бесплатном формате. Вдруг у кого есть