ЕК
А как мне тогда, если не средние? Ведь у меня большой датасет, где у каждого часа минимум 10тыс новостей. Я думаю, что нужно найти среднее количество просмотров для каждого сайта и визуализировать как-нибудь
Size: a a a
ЕК
DP
ИЭ
ЕК
ИЭ
ЕК
library(janitor)Но выходит просто прямая
grouped_news = tabyl(data, hours, views)
plot(grouped_age$hours, grouped_age$views, type="l", col="blue", xlab="hours", ylab="postes")
ЕК
a
DS
ЕК
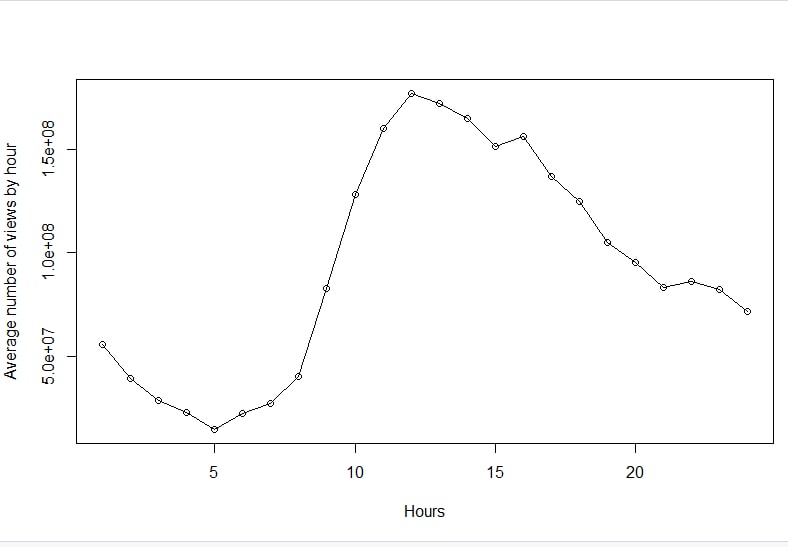
plot(m, ylab="Average number of views by hour", xlab="Hours", type = "o", col = "blue4")ЕТ
ЕТ
ЕК
EP
ЕК
EP
ЕК
PD
AS