М
Это каждый раз новый спамер?
Size: a a a
М
А[
А[
AS
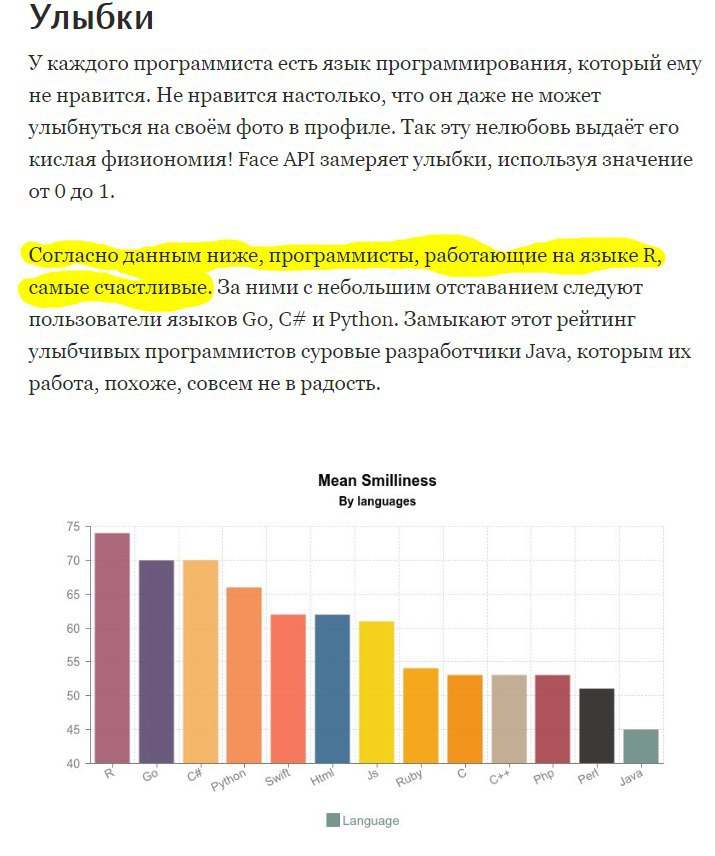
R
R
БА
AS
AS
БА
Ю
Ю
AS
А[
Ю
RZ
a
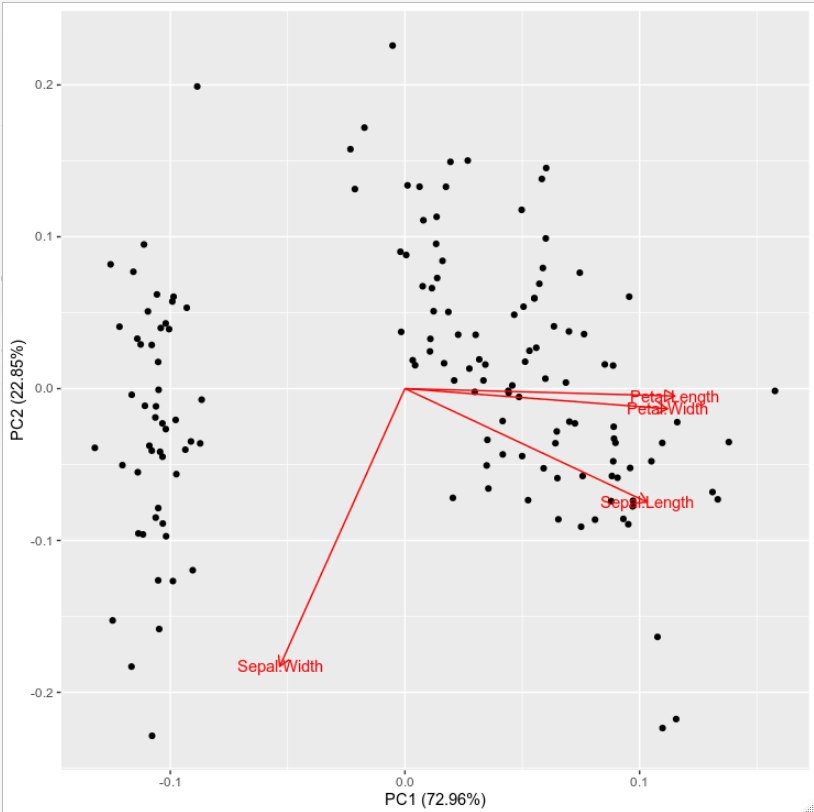
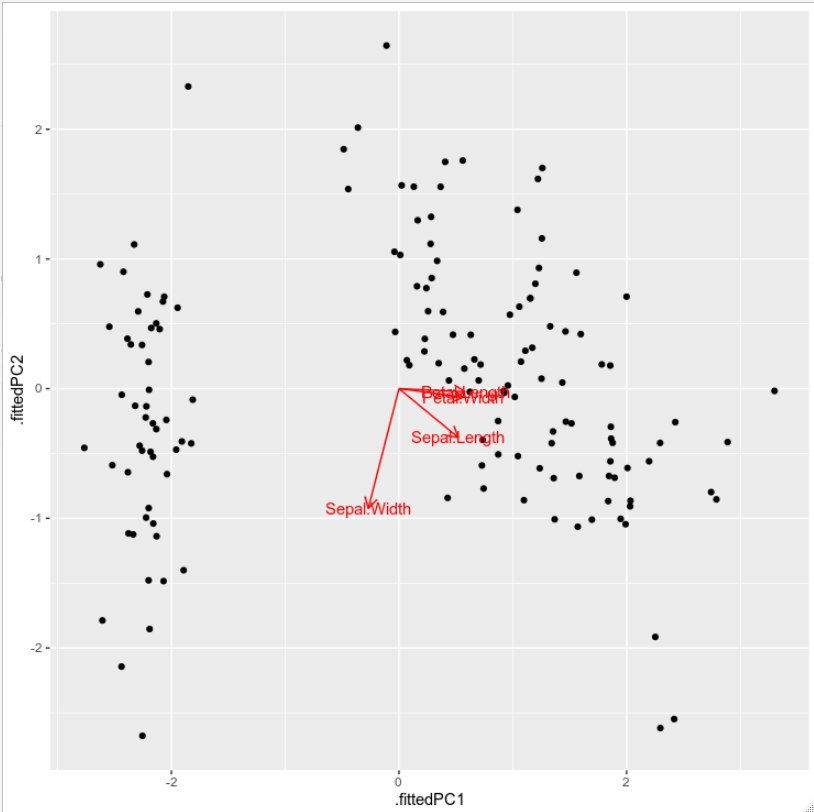
autoplot() (левый график) и при помощи базового ggplot2 (правый график). Однако у меня получается почему-то какая-то разница в шкалировании, хотя я ожидал одно и то же. В чем может быть дело?library(tidyverse)
iris %>%
select(-Species) %>%
prcomp(scale. = TRUE) ->
pca
library(ggfortify)
pca %>%
autoplot(loadings = TRUE,
loadings.label = TRUE)
pca$rotation %>%
as_tibble() %>%
mutate(variables = rownames(pca$rotation)) ->
rotation
pca %>%
broom::augment(iris) %>%
ggplot(aes(.fittedPC1, .fittedPC2))+
geom_point()+
geom_segment(data = rotation,
aes(xend = PC1, yend = PC2), x = 0, y = 0,
color = "red", arrow = arrow(length = unit(3, "mm")))+
geom_text(data = rotation,
aes(x = PC1, y = PC2, label = variables), color = "red")