


ГД
А можно фамилии в личку спссной и этого товарища? Описание не вызывает ассоциаций
Size: a a a
ГД
БА
PU
JL
JL
AS
O
AS
AS
AS
AS
K
K
p3<-ggplot(dat, aes(x = dat$goal_filled)) +
  geom_histogram(binwidth = 5) +
  scale_x_continuous( breaks = seq(from = 0, to = 200, by = 10), limits = c(0,200) ) +
  ylim(0, 100)
K

MS
K
K
> count(dat[,'goal_filled'])
        x freq
1       0  255
2       1   49
3       2   31
4       3   26
5       4   13
6       5   17
7       6   16
8       7   12
R
> count(dat[,'goal_filled'])
        x freq
1       0  255
2       1   49
3       2   31
4       3   26
5       4   13
6       5   17
7       6   16
8       7   12
R
K
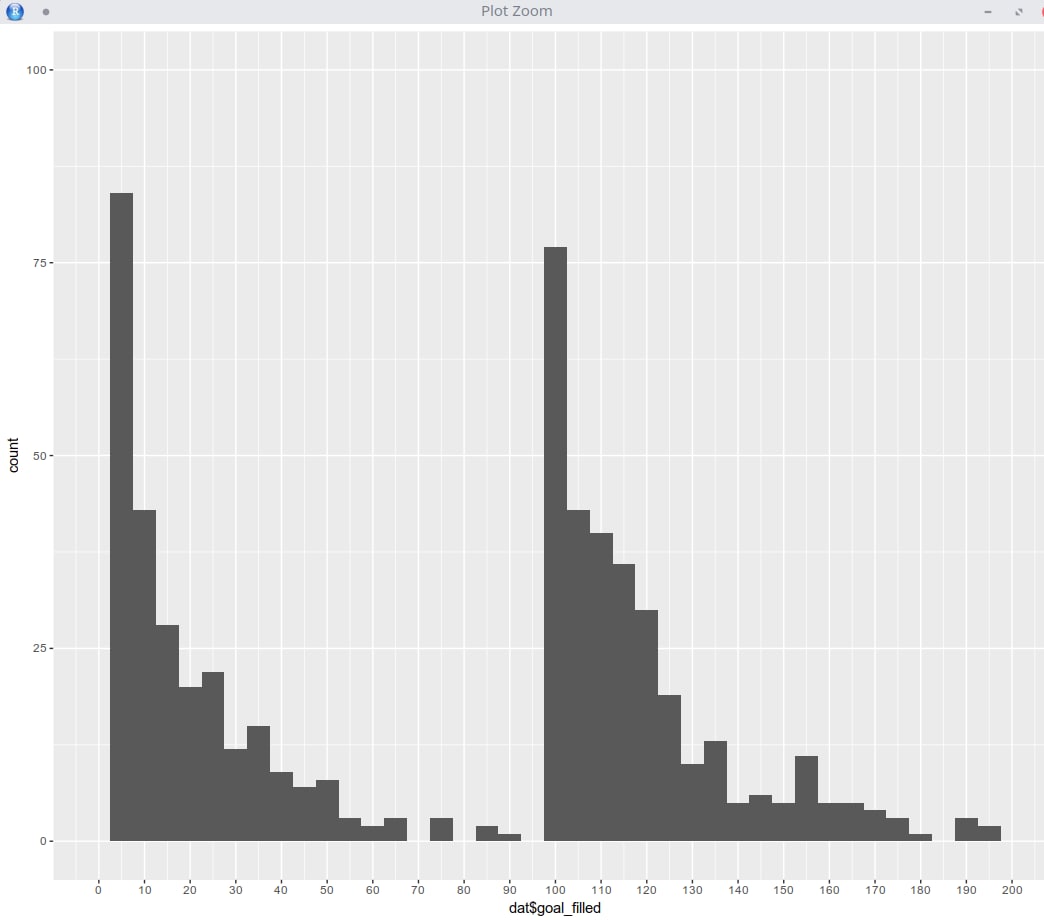
p3<-ggplot(dat, aes(x = dat$goal_filled)) +
  geom_histogram(binwidth = 10, boundary = 0, closed = "left" ) +
  scale_x_continuous(breaks = seq(0,200,10)) +
  coord_cartesian(xlim = c(0,200))
p3