TL
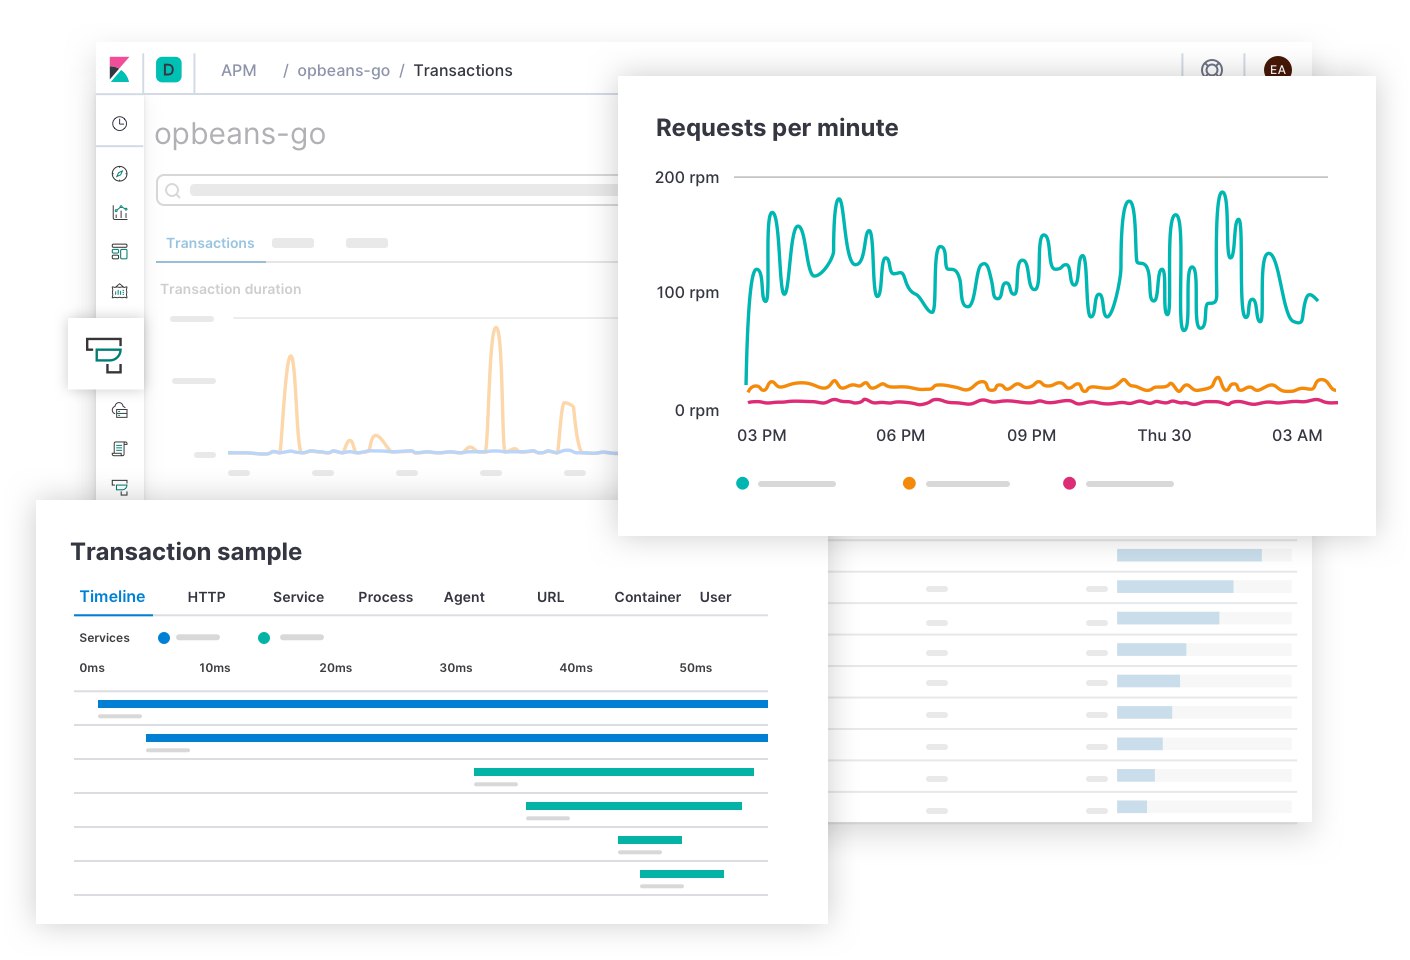
по сути мне нужно собрать данные по самым тяжелым "реквестам" и получить некоторое impact-значение (в зависимости от частоты вызовов) для них чтобы знать какие именно места нужно оптимизировать
Size: a a a
TL
TL
TL
TL
DS
TL
TL
DS
TL
NG
NG
TL
TL
DS
NG
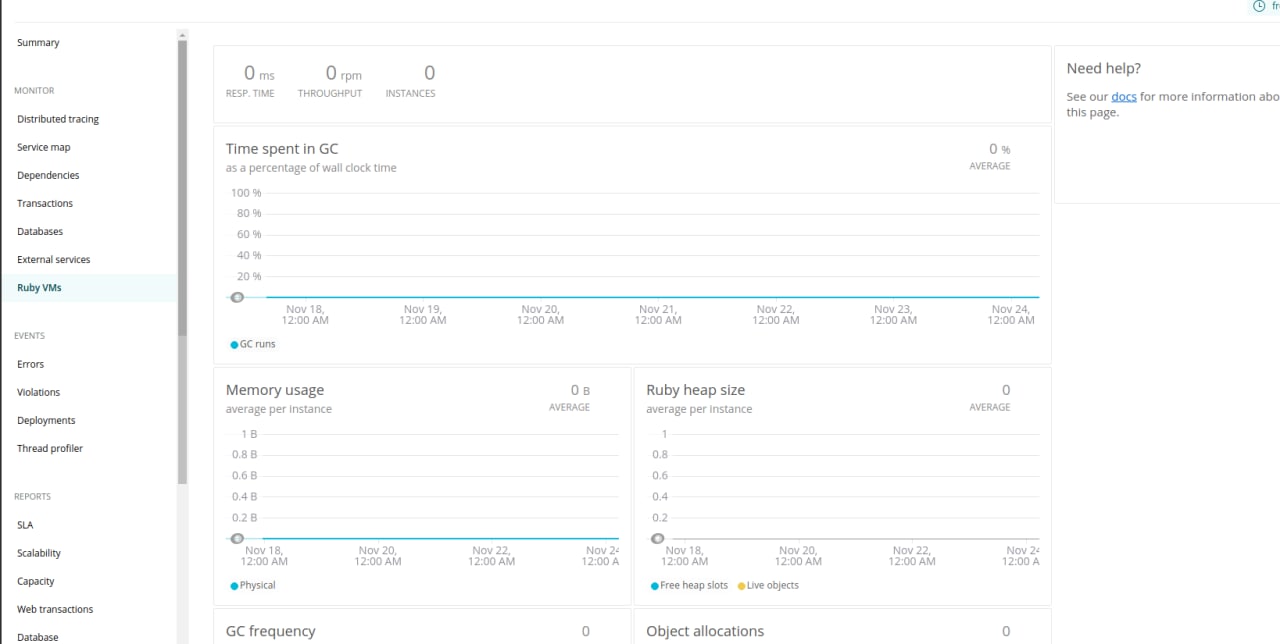
Welcome to New Relic's thread profiler
New Relic's low-overhead thread profiler can monitor and record executing threads for a specified time, without affecting the customer experience. When the profiling session is completed, New Relic shows where your code is spending time. With this feature you can:

Find performance bottlenecks at the code level
Uncover flaws in the application stack (virtual machine, app server, integration middleware, and more)
Reduce CPU utilization
Improve transaction response time
TL
TL
MS
MS