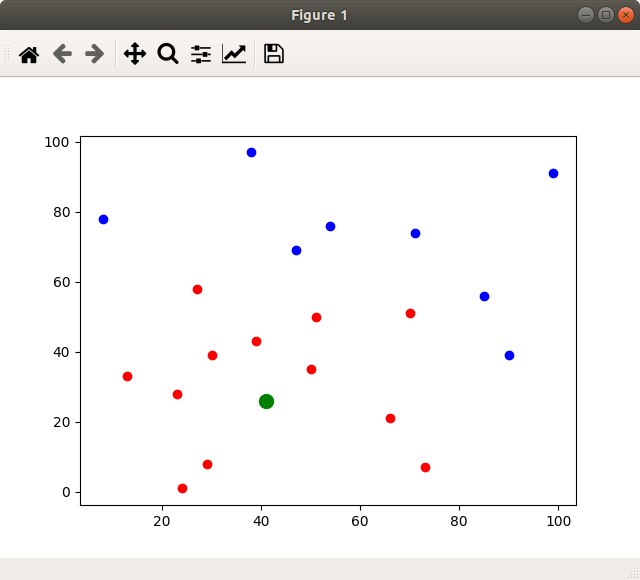
Вот такой скриптик на Python написал:
import matplotlib.pyplot as plt
import random
from math import sqrt

def draw_points(target_x, target_y, x_lst, y_lst, distance):
    for x, y in zip(x_lst, y_lst):
        # Pythagorean theorem
        a = abs(target_x - x)
        b = abs(target_y - y)
        c = sqrt(a**2 + b**2)

        color = "blue"
        if c < distance:
            color = "red"

        plt.plot(x, y, 'o', color=color)

# Случайные числа зафиксированны для воспроизводимости графика.
# Закомментировать или удалить для генерации разных чисел.
random.seed(196008)

x_lst = [random.randint(1, 100) for _ in range(20)]
y_lst = [random.randint(1, 100) for _ in range(20)]

target_point_x, target_point_y = random.randint(1, 100), random.randint(1, 100)

plt.plot(target_point_x, target_point_y, 'go', markersize=10)
draw_points(target_point_x, target_point_y, x_lst, y_lst, 40)

plt.show()