


AZ
Две мокрые вакансии в Полиомелите от 100к:
https://m.facebook.com/story.php?story_fbid=10217819259066598&id=1635966892
https://m.facebook.com/story.php?story_fbid=10217819259066598&id=1635966892
Size: a a a
AZ
OG
AZ
AG
АШ
AZ
АШ
MC
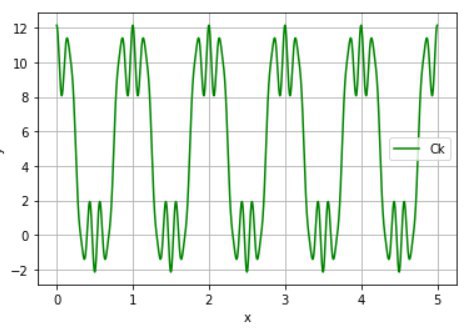
dots = []
dotsx =  np.arange(0.0001,5,0.0001)
f = 1
for t in dotsx:
    ut = 5+6.366*np.cos(2*pi*f*t) - 2.122*np.cos(3*2*pi*f*t) + 1.273*np.cos(5*2*pi*f*t) + 0.909*np.cos(7*2*pi*f*t)+ 0.707*np.cos(9*2*pi*f*t)
    dots.append(ut)

plt.subplot(1, 1, 1)
plt.plot( dotsx, dots,color='green', label='Ck')
MC
AZ
AZ
MC
AZ
MC
АШ
MC
AZ
АШ
MC
MC
